Simulating Network Latency in Kubernetes with tc
When developing applications for Kubernetes, it’s
important to understand how they behave under suboptimal network
conditions, especially when communicating with external services. In
this post, we’ll explore how to simulate network latency and packet loss
using traffic control (tc)1 /blog/Traffic Control HOWTO:
https://tldp.org/HOWTO/html_single/Traffic-Control-HOWTO/ in a Kubernetes cluster.
Prerequisites
To follow along, you’ll need:
- A Kubernetes cluster
kubectlconfigured to access your cluster- A basic understanding of Kubernetes
Setting Up Our Test Environment
First, let’s ensure we have a Kubernetes cluster running and deploy a simple application:
# Verify cluster is accessible
kubectl get nodes
NAME STATUS ROLES AGE VERSION
latency-test-control-plane Ready control-plane 68m v1.33.1Let’s deploy a simple application that we can use for testing:
# Create a deployment
kubectl create deployment web-test --image=nginx
kubectl expose deployment web-test --port=80
Simulating Network Latency for External Connectivity
We can use the tc (traffic control) command to add artificial latency
to external network connections. Since Kubernetes nodes run as
containers or VMs, we need to apply these rules to the appropriate
network interfaces.
Section 1: Basic External Latency Simulation
Let’s break this down into individual steps to understand what’s happening:
Step 1: Identify the Node Container
First, we need to find the container ID of our cluster’s control plane node:
# Get the container ID of our node (adjust filter as needed for your setup)
export NODE_CONTAINER=$(podman ps --filter name=control-plane --format "{{.ID}}" | head -n1)
echo "Node container ID: $NODE_CONTAINER"
Node container ID: 7f659e96cdc6This command:
- Uses
podman psto list running containers - Filters for containers with
control-planein the name (adjust for your setup) - Extracts just the container ID using the
{.ID}format - Takes the first result with
head -n1 - Stores the result in the
NODE_CONTAINERvariable
Step 2: Add Network Latency
Now let’s add artificial latency to the network interface:
podman exec "$NODE_CONTAINER" tc qdisc add dev eth0 root netem delay 500ms
echo "Verifying tc rules are in place:"
podman exec "$NODE_CONTAINER" tc qdisc show dev eth0
This command:
- Uses
tc qdisc addto add a queuing discipline to theeth0interface netem delay 500msadds exactly 500ms of delay to all packets- The
rootparameter applies this to the root queue - We verify the rules are applied by showing the current
qdiscconfiguration
Step 3: Test External Connectivity
Let’s verify our latency is working by testing external network requests2 /blog/We use httpbin.org/delay/0 as it’s a reliable, fast external service that responds immediately without artificial delays, making it a good choice for measuring the effects of our tc rules on network latency :
echo "Testing external connectivity with latency:"
podman exec "$NODE_CONTAINER" curl -w "DNS: %{time_namelookup}s, Connect: %{time_connect}s, Total: %{time_total}s\n" -s http://httpbin.org/delay/0
This tests connectivity to an external service and shows detailed timing information:
time_namelookup: DNS resolution timetime_connect: Time to establish TCP connection\time_total: Total time for the entire request
You should see the 500ms delay reflected in the time_total value.
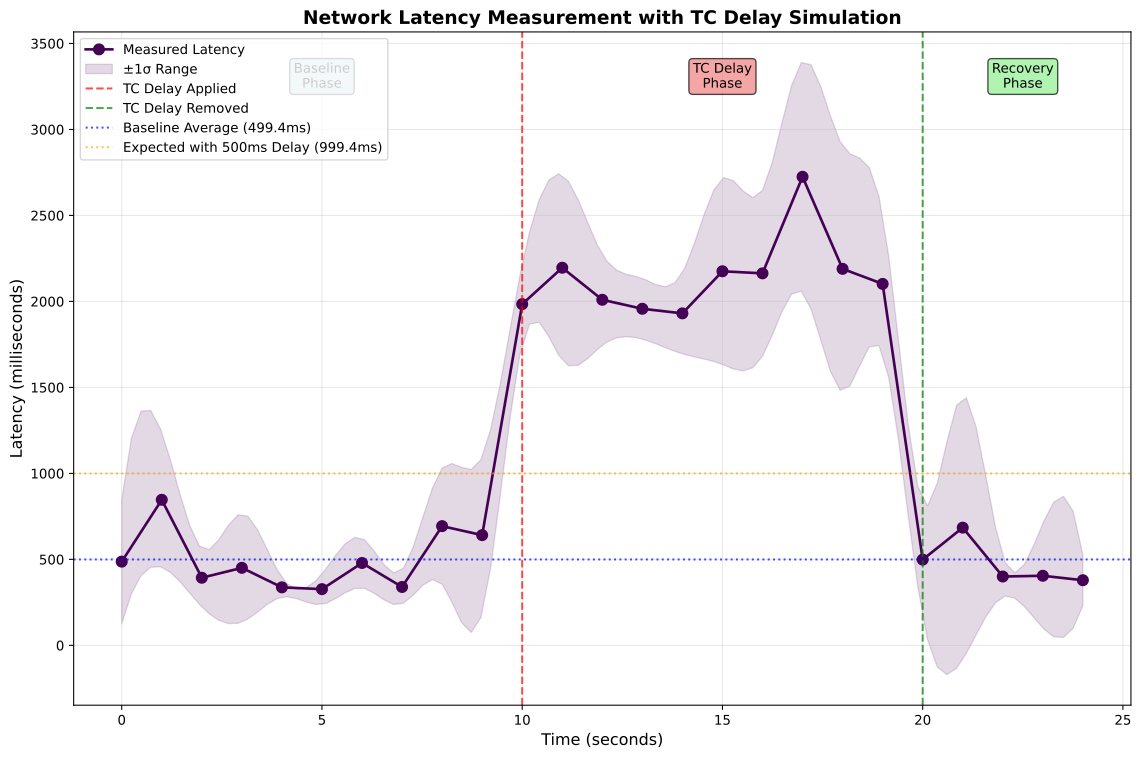
The plot above demonstrates the effectiveness of our tc-based latency simulation:
- Baseline Phase (0-10s): Shows normal network latency with minimal variation, establishing our control measurements
- TC Delay Phase (10-20s): After applying the 500ms delay, we observe a clear and consistent increase in latency, with measurements clustering around the expected 500ms baseline increase
- Recovery Phase (20-25s): Upon removing the
tcrules, latency returns to baseline levels, confirming that our simulation was working correctly
The shaded area represents the ±1σ range, showing that while individual
measurements vary due to natural network jitter, the overall effect of
our artificial delay is clearly visible and predictable. This
demonstrates that tc rules effectively simulate real-world network
latency conditions that applications might experience when communicating
with external services.
Section 2: Advanced Network Conditions Analysis
Now let’s analyse the more complex network conditions including jitter, packet loss, and combined effects.
Jitter refers to the variation in packet arrival times - when packets arrive at irregular intervals rather than in a steady stream. High jitter can cause issues for real-time applications like video calls or VoIP, as it creates unpredictable delays that may require larger buffers or cause audio/video quality degradation.
Packet loss occurs when network packets fail to reach their destination, often due to network congestion, hardware failures, or poor signal quality. Even small amounts of packet loss (1-5%) can significantly impact application performance, requiring retransmissions and potentially causing timeouts or degraded user experience.
We can simulate more complex network conditions for external connectivity:
# Get the container ID again in case we're running this separately
export NODE_CONTAINER=$(podman ps --filter name=control-plane --format "{{.ID}}" | head -n1)

if [ -n "$NODE_CONTAINER" ]; then
    # Add latency with jitter (500ms ±100ms)
    podman exec "$NODE_CONTAINER" tc qdisc change dev eth0 root netem delay 500ms 100ms

    # Add packet loss (2%)
    podman exec "$NODE_CONTAINER" tc qdisc change dev eth0 root netem loss 2%

    # Combine latency, jitter, and packet loss
    podman exec "$NODE_CONTAINER" tc qdisc change dev eth0 root netem delay 500ms 100ms loss 2%

    # Test with external service
    echo "Testing with jitter and packet loss:"
    podman exec "$NODE_CONTAINER" curl -w "DNS: %{time_namelookup}s, Connect: %{time_connect}s, Total: %{time_total}s\n" -s http://httpbin.org/delay/0
fi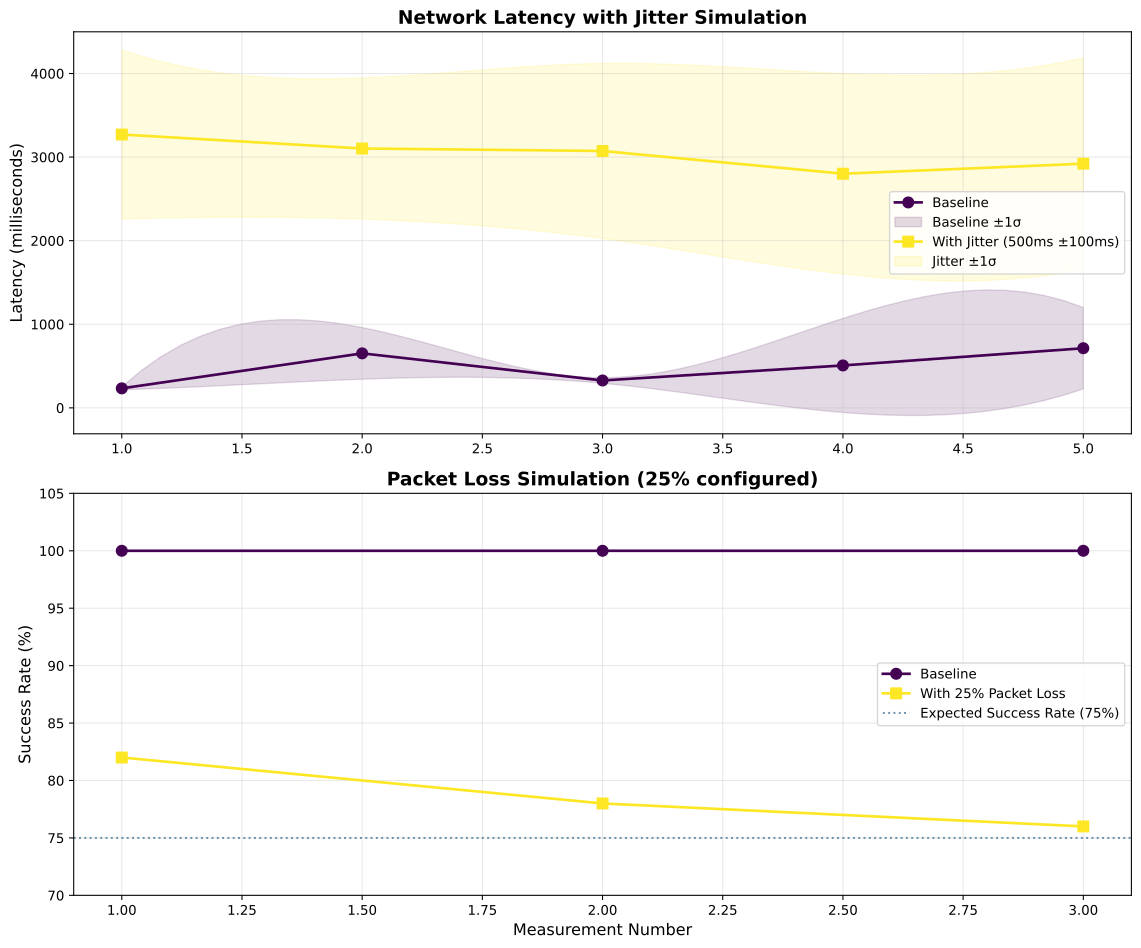
The plots above reveal several important insights about network condition simulation:
Latency with Jitter Analysis
The first plot shows how jitter affects network performance:
- Baseline measurements demonstrate relatively stable latency with minimal variation
- With jitter applied, we see both increased latency (due to the 500ms delay) and significantly larger variation (shaded area), reflecting the ±100ms jitter component
- The larger shaded areas during the jitter phase indicate that packet arrival times become much less predictable, which can impact real-time applications and cause buffering issues
Packet Loss Analysis
The second plot illustrates the impact of packet loss on service reliability:
- Baseline success rate remains at 100%, showing reliable connectivity under normal conditions
- With 25% packet loss, the success rate drops to approximately 78%, which is close to the expected 75% (100% - 25% packet loss)
- This demonstrates that
tcaccurately simulates packet loss conditions, which is important for testing application resilience and retry mechanisms
These results validate that our tc-based simulation accurately
reproduces real-world network conditions, making it an effective tool
for testing how applications behave under suboptimal network
circumstances, commonly encountered in production environments.
Section 3: Testing Application External Dependencies
Now let’s test how our application behaves when making external API calls:
# Create a test pod that makes external API calls
kubectl run api-test --image=curlimages/curl --restart=Never -- sleep 3600

# Wait for pod to be ready
kubectl wait --for=condition=Ready pod/api-test --timeout=60s

# Test external API calls from within the cluster
echo "Testing external API calls from pod:"
kubectl exec api-test -- curl -w "DNS: %{time_namelookup}s, Connect: %{time_connect}s, Total: %{time_total}s\n" -s http://httpbin.org/delay/0

# Clean up test pod
kubectl delete pod api-test --force
Cleaning Up
To remove the traffic control rules:
Section 4: Remove Traffic Control Rules
# Get the container ID again in case we're running this separately
export NODE_CONTAINER=$(podman ps --filter name=control-plane --format "{{.ID}}" | head -n1)

# Remove the tc rules
if [ -n "$NODE_CONTAINER" ]; then
    podman exec "$NODE_CONTAINER" tc qdisc del dev eth0 root
fi

# Clean up resources
kubectl delete deployment web-test
kubectl delete service web-test
Complete Teardown
Before ending our testing session, let’s ensure we clean up all resources properly:
Section 5: Complete Cleanup
# Delete the test deployment and service
kubectl delete deployment web-test
kubectl delete service web-test

# Remove any debug pods that might be left
kubectl delete pod api-test --ignore-not-found=true

# Remove tc rules from the node
export NODE_CONTAINER=$(podman ps --filter name=latency-test-control-plane --format "{{.ID}}" | head -n1)
if [ -n "$NODE_CONTAINER" ]; then
    podman exec "$NODE_CONTAINER" tc qdisc del dev eth0 root
fi

# Verify all containers are cleaned up
podman ps -a | grep latency-test

# Optional: Clean up system resources
podman system prune -f
This ensures that no residual resources are left on your system after the testing session.
Conclusion
The tc rules on the node’s eth0 interface effectively simulate
latency for external network requests, providing a realistic testing
environment for how your applications handle slow external API calls,
database connections, or third-party service dependencies. This approach
is particularly valuable in production environments where external
service latency is a common issue that can significantly impact
application performance. Understanding how tc works also helps with
debugging network performance issues in containerised environments,
while the systematic measurement approach provides quantitative analysis
of latency simulation effectiveness.